Studio711.com – Ben Martens

Weather

So Much Smoke

We’ve had a lot of smoke this year, largely due to the Bolt Creek Fire which is burning about 30 miles east of here. Whenever the winds are easterly, we get inundated with bad air quality. When someone asked “Has it been smokier this year?” I got to wondering how you would quantify that. To the data we go!

I run the studio711.com/air website which is a simple view of the air quality right around our house. When Elijah says “Is the air ok outside for me to play?” I can quickly open my phone and see. It pulls data from about 10 different sensors in our area (links for the detailed data are at the bottom of the page.) I’ve been running that since the summer of 2018 so that’s as far back as this post will cover. Here are some stats:

  • The smokiest day we ever had was September 15, 2020 when we hit 274 ug/m3 which is into the “Hazardous” range of the scale (the worst category.)
  • If we look at total days where we hit the “Unhealthy” category, 2022 has had the most (12 days) followed by 10 days in 2018 and 9 days in 2020. Dropping down to “Unhealthy for sensitive groups” gives the same ordering.
  • Looking at Unhealthy days by month, October 2022 ranks third on the list behind August 2018 and September 2020. And since we’re only about halfway into October, we could break that record this month. So far two thirds of our October days have had Unhealthy air quality. But the hope is that as things get cooler and wetter, the smoke should die down.

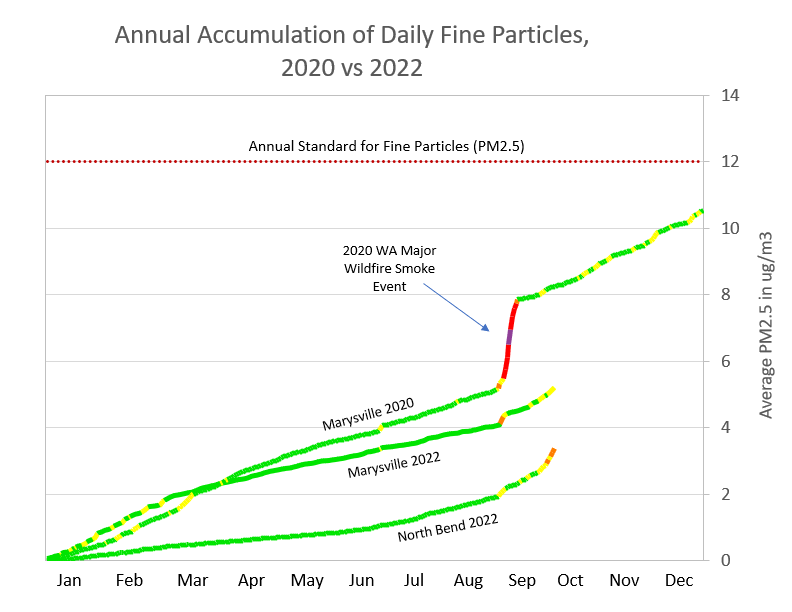
Looking at it in those terms, this has been a bad year, but looking at the year as a whole, we’ve had it rather good. We went very deep into the summer before we hit wildfire season. The Washington Smoke Blog has a good post about that showing that our total particle count this year is less than it was in 2020.

What’s going on? Why all the smoke? I won’t repeat the entire post, but if you’re interested, read Cliff Mass’s excellent post on what a “normal amount of smoke” is for this region. It is well-summarized by this chart showing the number of protected acres burned by year in Oregon.

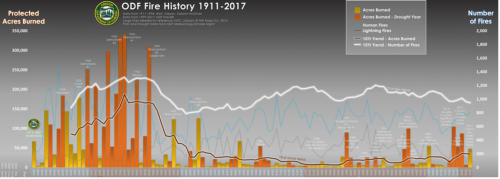
More fires have returned to the area, but these are healthy for the land and still very different from what “normal” was before we were trying to suppress every fire. He concludes his post with this: “wildfire is a natural element of Northwest ecology and meteorology and that the 50-year period of suppressed wildfire and smoke are anomalies from the natural state of the region.”

We wait all winter for dry, warm weather and when it finally comes, it’s easy to be frustrated by the smoke. Thankfully, modern HVAC systems do a good job at protecting us during these periods even if it does mean that we need to carefully monitor the amount of time we spend outside.

Record-Breaking Heat

By this point you’ve seen all the stories about the Pacific Northwest heat wave that is finishing up, but I wanted to record some of it here for the future.

It ramped up on Friday and hammered us Saturday, Sunday and Monday. Cliff Mass had lots of great blog posts, but I’ll copy a bit from his June 25 post to explain what led to our heat wave:

Ingredient One: An unusually strong area of high pressure aloft over our region (known as an upper-level ridge), associated with sinking air and unusually warm temperatures.  

At the surface, this feature is associated with high pressure to the east of the Cascade crest, which tends to produce weak offshore (easterly) flow.  Such easterly flow keeps the cooling influence of the Pacific Ocean away…

Ingredient Two: An Approaching Trough of Low Pressure That Creates Strong Easterly/Downslope Flow over the Western Slopes of the Cascades

The air will start off warm, with origins from the desert southwest, but will warm further as it descends the Cascades into western Washington. Why warm more? Because the air will be compressed as it descends into western Washington.

https://cliffmass.blogspot.com/2021/06/the-reason-for-extreme-warmth-on-monday.html

To put this in context, Seattle has only had three days over 100 degrees in the past 100 years. Most of the daily records for this time of year are around 90. Any day over 80 gets people talking about how hot it is and only 44% of people have air conditioning.

  • The old all-time record for heat in Seattle was 103. Seattle broke it’s record on Sunday and then immediately broke it again on Monday, finally topping out at 108!
  • That high of 108 in Seattle means that Seattle has now been hotter than cities like Miami, Atlanta, Washington DC, Indianapolis, Orlando, or Chicago!
  • Portland hit 116 and in terms of the ~50 biggest cities in the country, that is third on the list behind only Phoenix (126) and Las Vegas (117).
  • The previous maximum low temperature was in the low 70s, but Seattle never got below 80 on Saturday night and spent every minute of Monday at 80 degrees or above!
  • The eastern side of the state had two places hit 118, tying the record.
  • Forks hit 110 which is 45 degrees over their normal temperature for this time of year!
  • The cool down on Monday evening was incredible as well. It went from ~110 to under 70 in less than 12 hours. Forks recorded a 28 degree drop in one hour!
https://cliffmass.blogspot.com/2021/06/even-more-extreme-extraordinary-record.html

Here in Woodinville, it’s hard to get an exact, calibrated measurement but based on the official sensors closest to us, I’m confident that we hit at least 108 or 109. The city about 2 miles to the west (Bothell) of us recorded 110 and the city about 6 miles west of us (Lake Forest Park) hit 111. We were very thankful for our air conditioning and it did a good job keeping up, topping out at 80 degrees on Monday before pulling it back down to 76 where we have it set.

Every few hours over the weekend, I went out to read the kWh usage off my electric meter. My Thermostat (Ecobee) records the usage per second and I store all that info in a database. So I was able to combine all that info together and build up a little model to estimate how much it costs when my air conditioner is running. It comes out to around $0.30/hour. (It’s about $0.08/hour with no air conditioner.) When the temp is in the mid 80s, the AC will kick on around noon or 1 and run until 10 or 11 at night. On a day like that we’d spend around $3 to have the AC on. I don’t think that’s going to change anything about how I use it, but it’s something I’ve always wondered about!

Tuesday was “only” around 90 and the rest of the week will be in the low 80s. That’s still above normal but I don’t think there will be a lot of complaints.

Cool Weather

The Pacific Northwest is breaking all kinds of rain records this winter. For example, looking at the period between Oct 1 and Sept 30, we have already received more than the average rain for that entire period. But it’s not just the rain that has been unique this year. We’re also having much cooler temps.

March is over and by now we have usually enjoyed a few 60 degree (or even 70 degree) days mixed in with the standard “low 50s and rainy” weather. But not this year. KOMO posted an article a while back showing the history of the longest wait to reach 60 degrees. The record was April 11 back in 1954. We are rapidly climbing up the list! Tuesday and Wednesday are both forecast to be right around 60 so we’ll see how far we climb before we get a day at 60 or above.

  1. April 11: 1954
  2. April 8: 1957
  3. April 7: 1959
  4. April 4: 1950
  5. April 4: 1971
  6. April 3: 2002
  7. April 2: 1967
  8. March 31: 2000
  9. March 30: 1976
  10. March 29: 2003

In my head I hear the yodeling song from Cliffhanger on the Price Is Right.

[UPDATE] SeaTac had a high of 60 on April 4 so we tied for #4 on the list.

Coldest Winter

We have only been in our current house for 5 winters, but this is by far the most we’ve ever paid to heat it during the winter. One month was 40% higher than our previous max and we’ve even had the thermostat turned down lower than it was in previous years.

Cliff Mass has a post up showing that this is the coldest Seattle winter in 32 years! It hasn’t been hard to notice the extended periods of colder than average weather. I hope that it breaks soon and we can start getting some spring weather, but there’s no end in sight.

This cold wet weather has made for a pretty spectacular ski season, or so I’ve heard. I think I’ll be finishing up the year with 0 ski days.

Snow Days

We went a few years without any snow in the lowlands (that’s what we call the area where we live as opposed to the foothills or the mountains.) But this year, we’ve had two snow events! This most recent one hit on Sunday evening after the Super Bowl. The forecaster that I follow, Cliff Mass, did a great job of showing the uncertainty around the forecast and what all the various models were showing. The average of all the models nailed the forecast this time and we ended up with 5″ of snow at our house. People who live on the higher hills (500-1000 feet above us) got an extra foot.

This closed everything down on Monday. It started to melt a bit on Monday evening and then it all froze up on Tuesday which canceled schools again on Tuesday. Now we’re melting it all down with more normal weather (50 and rainy.)

The last time we had snow, Elijah couldn’t get enough of sledding, building snowmen, etc. This time he wasn’t as interested in those things and had more fun with his shovel and wheelbarrow. I did get a good giggle out of him though as I clipped into my skis and took a slow run down our street.

All the heavy snow on the branches cause a lot of trees and branches to come down. A small one fell across the street from our house and a lot of big limbs came down at the church. I stopped by on Tuesday night and took six loads of branches over to the brush pile. There was some minor damage to the playground that I’ll repair as well. But we were lucky. At the peak, there were over 200,000 people without power!

This wasn’t the worst snow storm in Seattle history but it’s up there pretty high. It was nice to be able to stay at home for the most part and not feel pressure to drive anyway. I’m able to work from home and Elijah’s school was canceled so it all worked out well.

Heat Storm

heatstorm
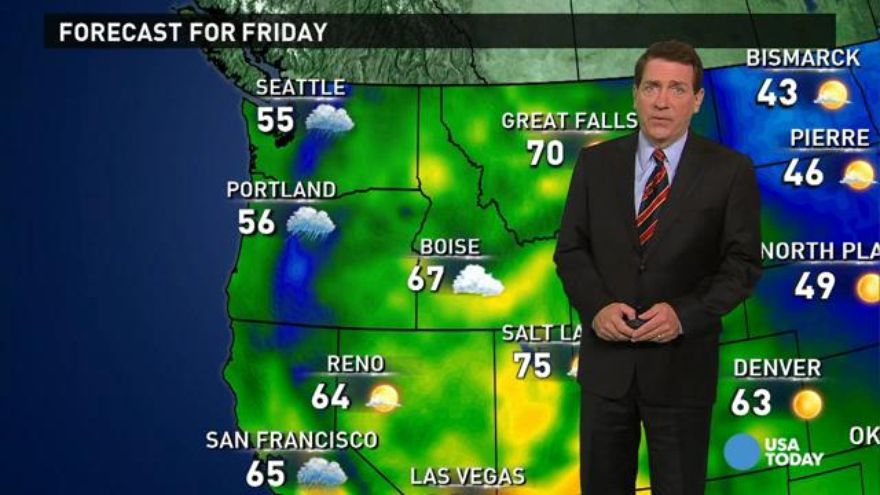
If you live in the Pacific Northwest, get ready to bare those pasty white legs because a heat storm is coming! Ok a “heat storm” probably isn’t a real thing but it’s a good way to describe what’s going to happen today. Here in the early part of April when high temps are normally in the 50s, we are going to top out somewhere in the 80s! Cliff Mass has a great breakdown of the forecast, but the root of this is because of a huge high pressure ridge just off the coast. It keeps down the cool marine breezes, pulls air from the warmer eastern part of the state and creates downslope warming (air is warmed by compression as it flows down the mountain slopes.)

Get outside and enjoy it! We still have months of 60 degree rainy weather ahead of us before summer really takes hold.