I’ve been happily using OpenSprinkler to control my irrigation system this year. One of its many features is logging how long each zone is on, but I haven’t done much with those logs yet. Last weekend, I decided to dig in to the data.
The first thing I did was write a little app that runs every morning, checks the latest logs, and uploads the new data to a SQL database in Azure.
Then I stood out by the water meter and figured out how much water each zone used. That included the startup usage (since water drains out of some heads when the zone is off) and the usage per minute. That let me calculate how much water I’ve been using over the past few months.
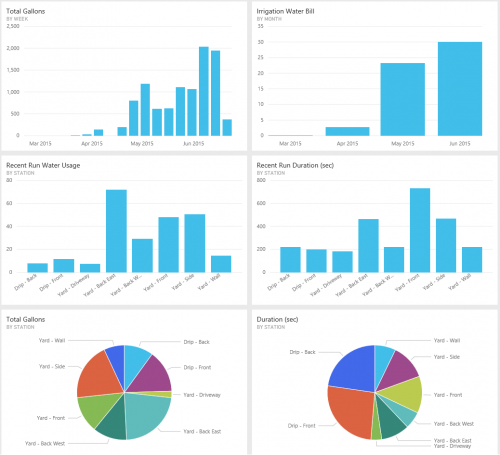
I fired up Power Query for Excel and brought in all the data so I could get some nice Power View charts and graphs going. (Note that I could also have used the new Power BI Designer instead of Excel, Power Query and Power View.) I saved that workbook to OneDrive and imported it into PowerBI.com. I set up PowerBI.com to automatically refresh the workbook every morning and show me the charts on a dashboard.
It might sound complicated but it only took me about an hour of work and that included standing out by my water meter for 15 minutes. Now I can fire up the PowerBI.com website every day and analyze my water usage. Since this isn’t based on an actual water flow meter, it won’t help me find leaks, but it does help me get an idea of how much money I’m spending to keep my yard green. I’m also working on some new features that will keep track of the high and low temperatures each day along with the precipitation.
You can get a long way in Power BI before you need to pay for anything so go give it a shot if this sparks some ideas in your head.